Cloning of Thalassiosira pseudonana’s Mitochondrial Genome in Saccharomyces cerevisiae and Escherichia coli
Published in Biology, 2020
Recommended citation: RR. Cochrane, SL. Brumwell, A. Shrestha, DJ. Giguere, S. Hamadache, GG. Gloor, DR. Edgell, and BJ. Karas. (2020). "Cloning of Thalassiosira pseudonana’s Mitochondrial Genome in Saccharomyces cerevisiae and Escherichia coli." Biology. 9(11): 358. https://ryanrcochrane.github.io/files/paper3.pdf
ABSTRACT Algae are attractive organisms for biotechnology applications such as the production of biofuels, medicines, and other high-value compounds due to their genetic diversity, varied physical characteristics, and metabolic processes. As new species are being domesticated, rapid nuclear and organelle genome engineering methods need to be developed or optimized. To that end, we have previously demonstrated that the mitochondrial genome of microalgae Phaeodactylum tricornutum can be cloned and engineered in Saccharomyces cerevisiae and Escherichia coli. Here, we show that the same approach can be used to clone mitochondrial genomes of another microalga, Thalassiosira pseudonana. We have demonstrated that these genomes can be cloned in S. cerevisiae as easily as those of P. tricornutum, but they are less stable when propagated in E. coli. Specifically, after approximately 60 generations of propagation in E. coli, 17% of cloned T. pseudonana mitochondrial genomes contained deletions compared to 0% of previously cloned P. tricornutum mitochondrial genomes. This genome instability is potentially due to the lower G+ C DNA content of T. pseudonana (30%) compared to P. tricornutum (35%). Consequently, the previously established method can be applied to clone T. pseudonana’s mitochondrial genome, however, more frequent analyses of genome integrity will be required following propagation in E. coli prior to use in downstream applications.

Figures and Tables
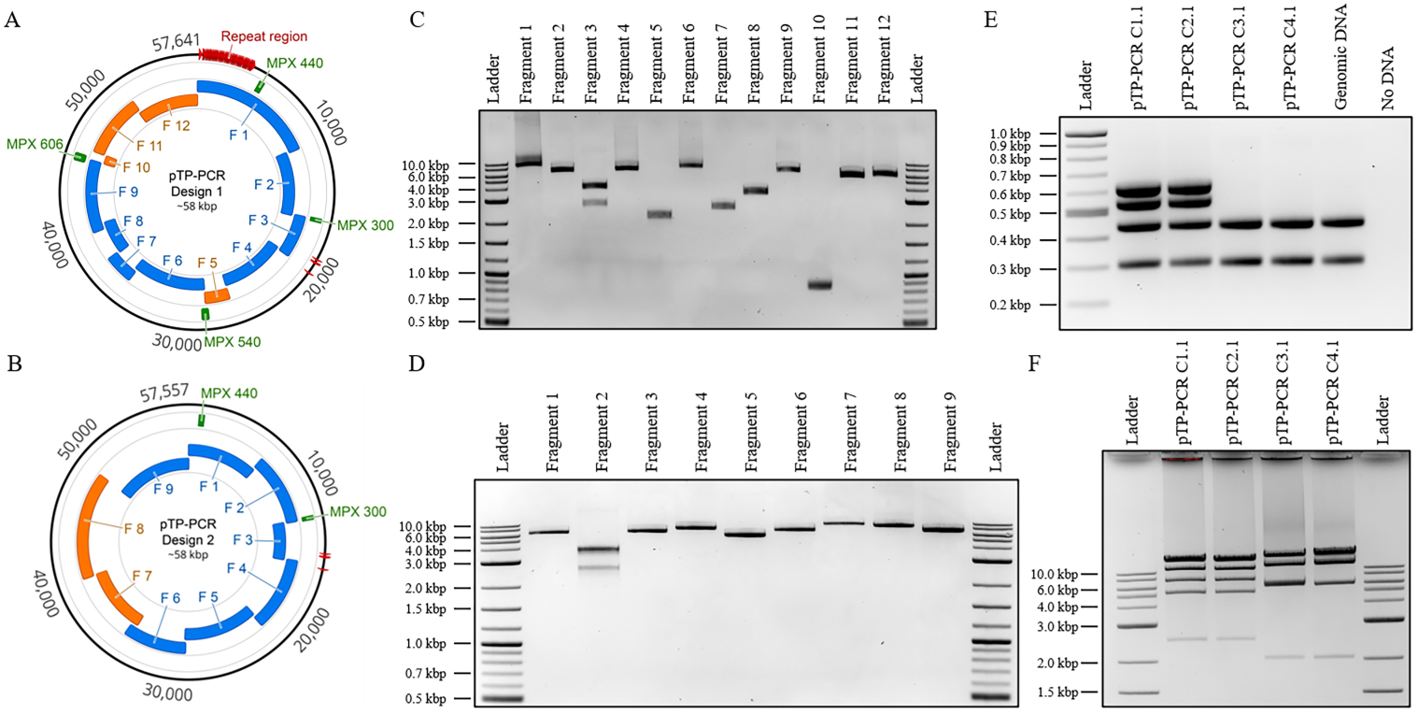 **Figure 1. Design, amplification, and analysis of cloned T. pseudonana mitochondrial genomes. (A,B) Plasmid maps of T. pseudonana mitochondrial genomes cloned with the repeat region (A—Design 1) or without (B—Design 2). The relative sizes and positions of the mitochondrial genome fragments (blue) and plasmid backbone fragments (orange) are shown. In addition, the four multiplex polymerase chain reaction (PCR) amplicons used for diagnostic screening and their sizes in bp are indicated (green). These images were generated using Geneious version 2020.2.4, created by Biomatters. (C) Agarose gel electrophoresis of the 12 PCR-amplified fragments used to assemble plasmids as specified in Design 1. The resulting amplicon sizes for fragments 1 to 12 are 10,735, 6092, 3610, 6274, 2152, 7035, 2512, 3250, 6216, 859, 5367, and 5870 bp, respectively. Note: for fragment 3, there was a nonspecific amplicon; however, it did not prevent the correct assembly. (D) Agarose gel electrophoresis of the nine PCR-amplified fragments used to assemble plasmids as specified in Design 2. The resulting amplicon sizes for fragments 1 to 9 are 6092, 3610, 6254, 7174, 5417, 6372, 9136, 8441, and 6810 bp, respectively. Note: for fragment 2, there was a nonspecific amplicon; however, it did not prevent the correct assembly. (E) Multiplex PCR screen of four cloned algal mitochondrial genomes isolated from E. coli with expected amplicon sizes of: 300, 440, 540, and 606 bp. Note: Multiplex amplicons 540 and 606 bp can only be amplified for Design 1 genomes. (F) Diagnostic restriction digest of the four cloned algal mitochondrial genomes. For Design 1 genomes (pTP-PCR C1.1/2.1), after PvuI restriction enzyme digestion, the expected band sizes are 6, 2454, 4862, 6262, 12,903, 15,405, and 15,749 bp. For Design 2 genomes (pTP-PCR C3.1/4.1), after PmeI and BamHI restriction enzymes digestion, expected band sizes are 2031, 5693, 12,012, 16,721, and 20,960 bp.
**Table 1. Cloning of the T. pseudonana full and reduced mitochondrial genomes in the host organisms S. cerevisiae and E. coli. Two PCR-cloning assemblies were performed in S. cerevisiae. Correct genomes identified by multiplex PCR were subsequently transformed into E. coli. The diagnostic multiplex PCR was repeated on E. coli clones, and final genomes selected. For the E. coli media, CM indicates chloramphenicol antibiotic. Four-amplicon multiplex PCR as shown in Figure 1E were used. 
**Table 2. Summary of mutations identified in the cloned T. pesudonana mitochondrial genomes. Identified mutations are categorized as point mutations (synonymous, missense, nonsense, and those found in non-coding regions) or gap mutations (insertions and deletions, either non-coding or coding). 
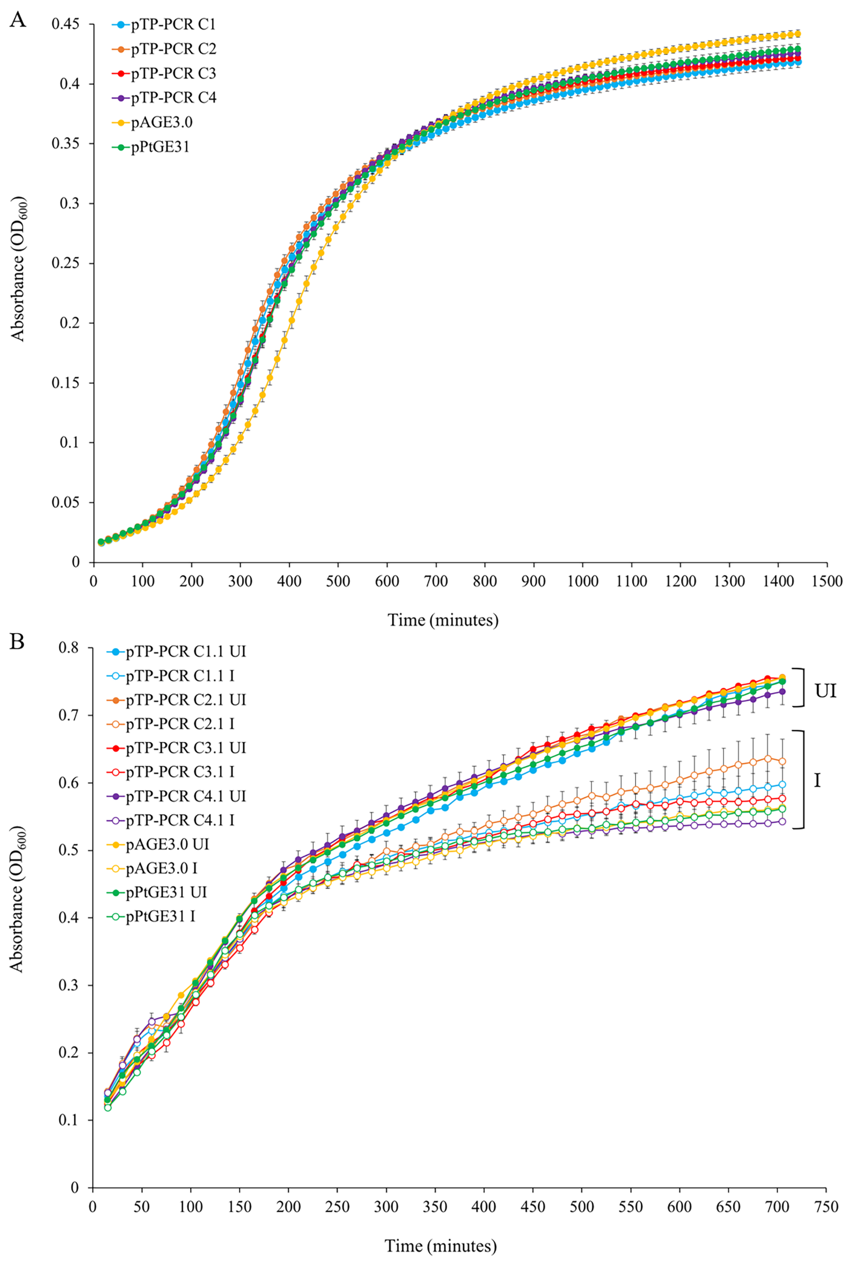 **Figure 2. Growth of host strains harboring cloned T. pseudonana mitochondrial genomes in liquid media. (A) Growth curves of S. cerevisiae strains grown in liquid synthetic complete media lacking histidine. (B) Growth curves of E. coli strains grown in liquid Luria-Bertani (LB) media supplemented with chloramphenicol only (UI—un-induced) or with chloramphenicol and arabinose (I—induced). Each time point is the average of three biological replicates, each with four technical replicates, and error bars representing standard error of the mean.
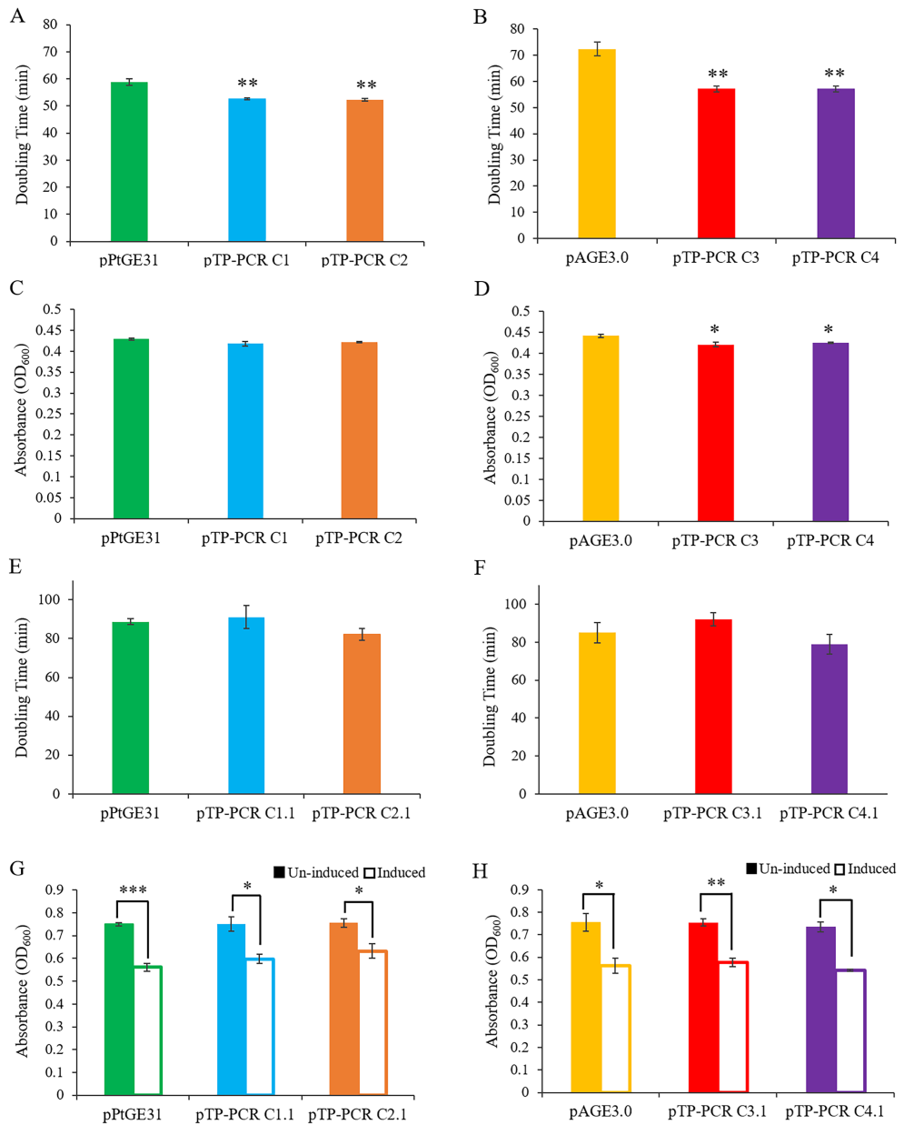 *Figure 3. Growth phenotypes of S. cerevisiae and E. coli harboring a cloned T. pseudonana mitochondrial genome. The growth rate of S. cerevisiae harboring the full (A) and reduced (B) mitochondrial genome of T. pseudonana compared to control plasmids pPtGE31 and pAGE3.0, respectively. The maximum cell density reached by S. cerevisiae harboring the full (C) and reduced (D) mitochondrial genome compared to control plasmids. The growth rate of E. coli harboring the full (E) and reduced (F) mitochondrial genome, compared to control plasmids (uninduced conditions). Maximum cell density reached by E. coli harboring the full (G) and reduced (H) mitochondrial genome compared to control plasmids. Maximum density was compared in un-induced and arabinose induced conditions. Note: Solid bar represents un-induced and outlined bar represents induced conditions. Three biological replicates, each with four technical replicates, were used for data analysis. The scores represent means ± standard error of three biological replicates. Asterisks represent a significant difference from control plasmid (A–F), and/or between un-induced and induced E. coli harboring the same plasmid (G–H) (Student’s t-test: * p < 0.05, ** p < 0.01; ** p < 0.001).
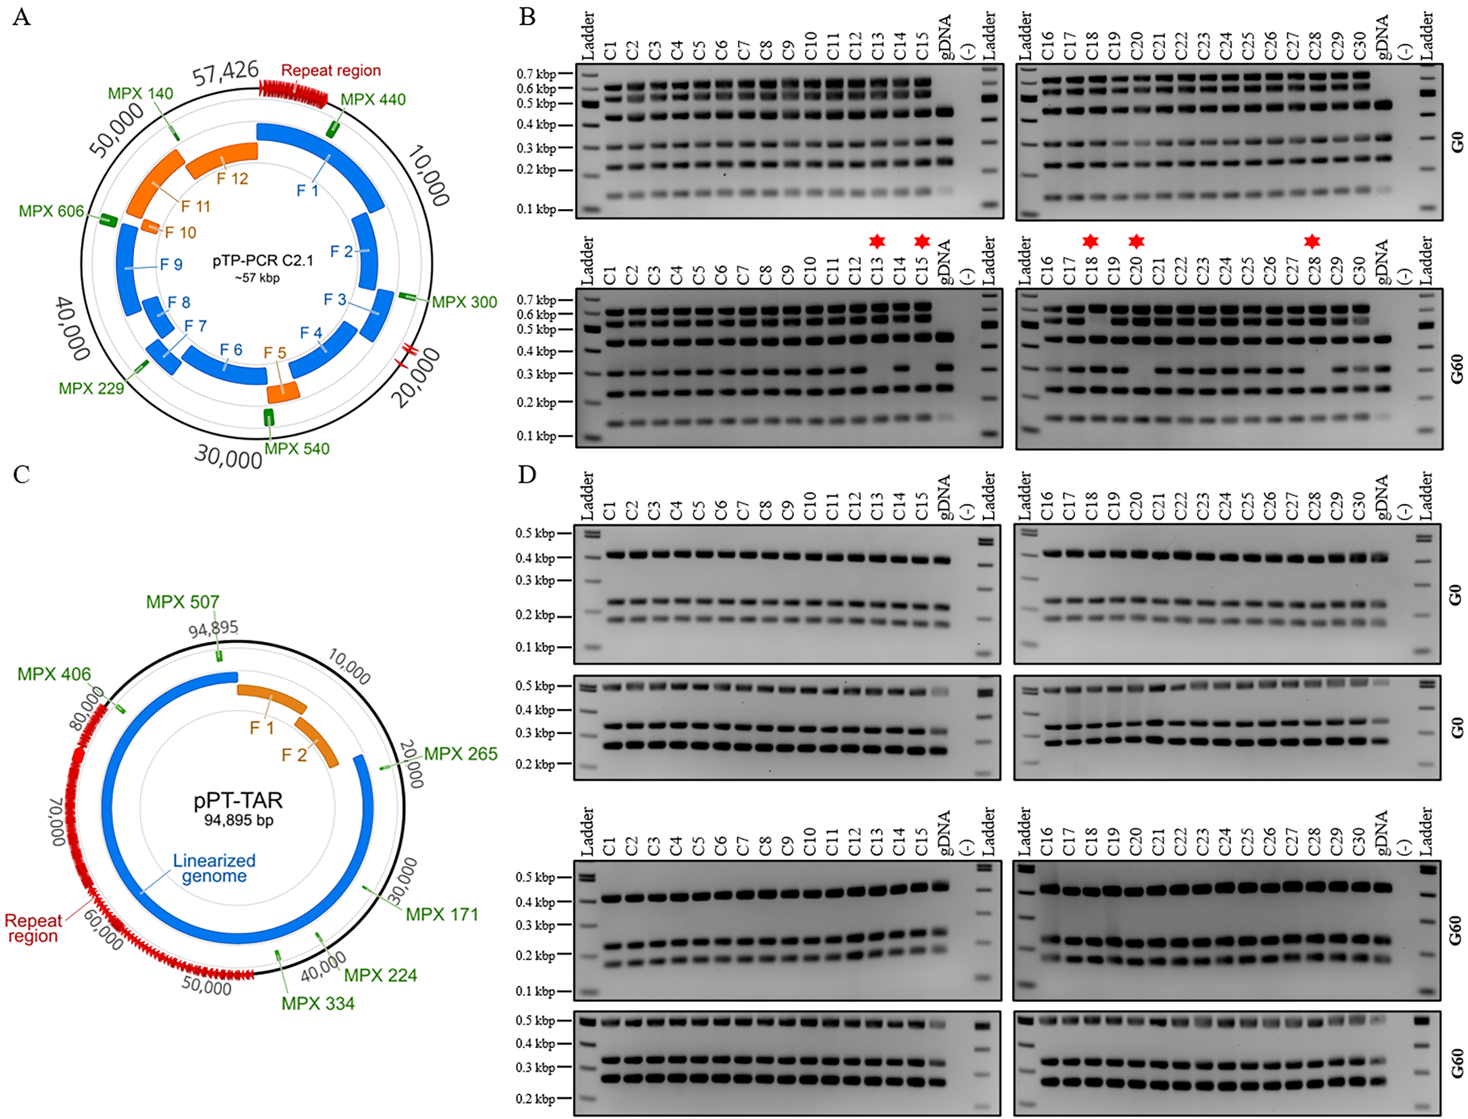 **Figure 4. Plasmid stability assay of cloned T. pseudonana and P. tricornutum mitochondrial genomes over 60 generations. Thirty single colonies of either pTP-PCR C2.1 (A,B) or pPT-TAR C1 (C,D) were assayed by multiplex PCR after transfer from yeast to E. coli (G0), and after approximately 60 generations (G60) in liquid LB media supplemented with chloramphenicol (15 μg mL−1). Notes: 1—in (B), (G60) colonies 13, 15, 18, 20, and 28 (red asterisk) are missing one PCR amplicon; 2—for T. pseudonana genomic DNA (gDNA), only the three fragments were expected to amplify, 229, 300, and 440 bp, but a small nonspecific band is also visible around 150 bp.
Recommended citation: RR. Cochrane, SL. Brumwell, A. Shrestha, DJ. Giguere, S. Hamadache, GG. Gloor, DR. Edgell, and BJ. Karas. (2020). "Cloning of Thalassiosira pseudonana’s Mitochondrial Genome in Saccharomyces cerevisiae and Escherichia coli." Biology. 9(11): 358.